Introduction to Google Science Journal
Google science journal The physical world around us is full of exciting natural phenomena that arises a number of questions in our mind about how things work and relate with each other. Among the various occurring in our surrounding we have some measurable quantities that help us to understand and learn about them such as light, sound and speed. All explain the answers about how the world around us work. Google science journal is an excellent tool that helps you to observe, record, measure and document the data using your phone. It uses already present sensors in the mobile phone, measures the quantity, record the data and graph them.It is simple, easy to use that anyone can use it to create document, gather information, record experiments and observation.
Light Intensity
You can use google science journal to measure light intensity using built in light sensor of mobile following the simple steps

- Pull up the bottom slider when you open up the app and enter into the observe mode.
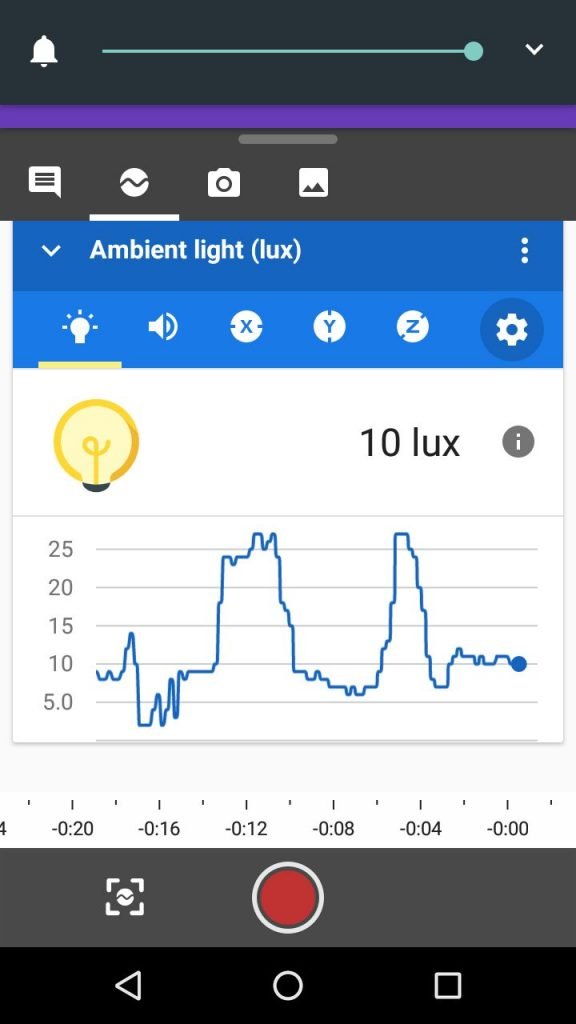
- Select the white bulb and then you can measure the light level in LUX which is the S.I unit of Light intensity.
- The screen will display both Meter mode (real time reading) and Graphical mode to observe the change with respect to time.
- For the accurate measurement, find the location of light sensor on your phone.
- Put the mobile in the bright light, open the graph mode and hover your finger over the phone. When the finger block the light sensor, the value on the graph will drop.
- You can also try by using flash light, when it comes over the sensor directly the value increases.
- You can perform simple experiments using this like observing light intensity during day.etc.
Sound Intensity
Sound Intensity can be measured by using Google Science Journal by using phone’s microphone.

- Enter in to Observe mode using slider at the bottom after opening the app.
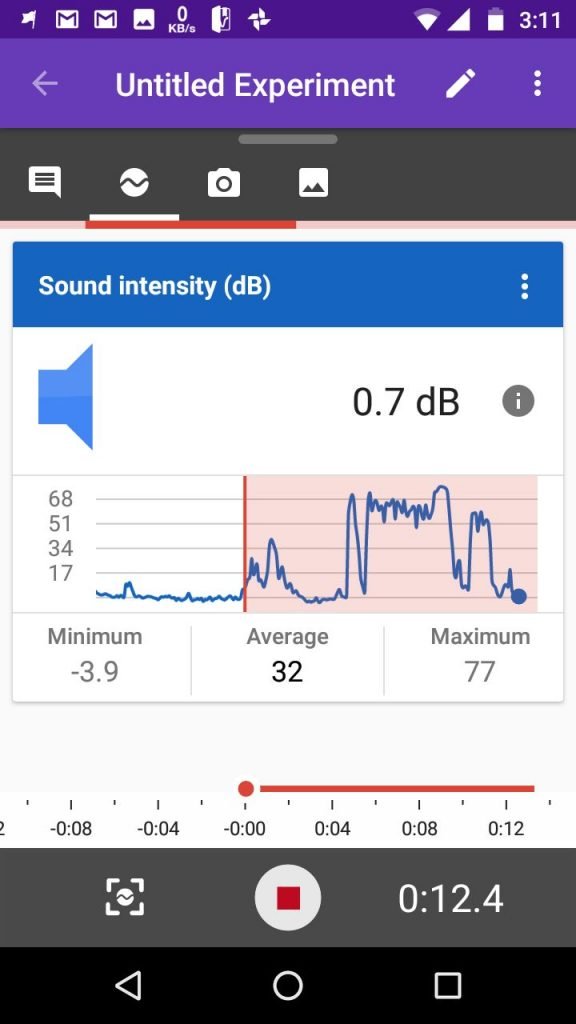
- Select speaker icon and you can measure the sound intensity in decibels.
- Both instantaneous reading meter and graph with respect to time will be available below.
- For the accurate measurement, make sure that the microphone is not covered or blocked by anything.
- You can now measure the noise level of different places like home, play and at work.
- Also the relation of sound with distance can be measured with this.
Google Science Journal Acceleration
Acceleration in x, y and z direction can also be measured by using built in accelerometer of mobile with Google Journal.

- From the bottom slider enter into the observe mode.
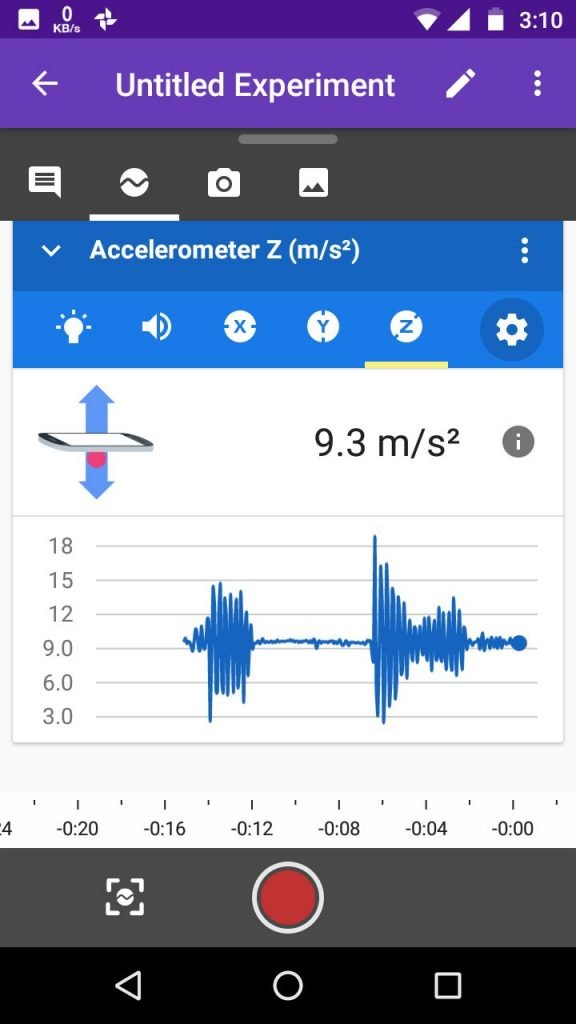
- You can select x, y or z to measure the acceleration side to side, to and fro, up and down with respect to mobile phone.
- Meter mode shows the instantaneous reading and below it you can see the graph against time and speed with which you move the phone.
- You can perform simple experiments as measuring your acceleration while walking or to detect vibration.
- Sometimes you may observe the reading of 9.8 m/s2 while your phone at rest, the reason is that the accelerometer also measures gravity which always points downward.
- Depending on the phone orientation, part of the gravity vector line up with the x, y or z direction of the phone that results in a non-zero reading when the phone is at rest and this ability allows you to control the direction of your car in a racing game by just tilting your phone.
Data Record
To record data in Google Science Journal, open any sensor in meter or graph mode and press the record button after setting up your phone for experiment to start recording.

- Perform your experiment and again press record button to stop the recording
- You can crop the data by selecting crop from the 3 dot button in upper right corner.
- Move the two sliders to crop the data you want to keep and then press the check mark.
- Notes can be added to data by selecting notes icon and trial can be renamed by selecting pencil icon.
- You can export the data by selecting the 3 dot icon in the upper right to gmail and google drive in csv (comma-separated values) file format.
- If the option is not available, try uninstall and reinstall the app, make sure to enter correct year of birth as the expert option is not available below 13.


